
Dumont
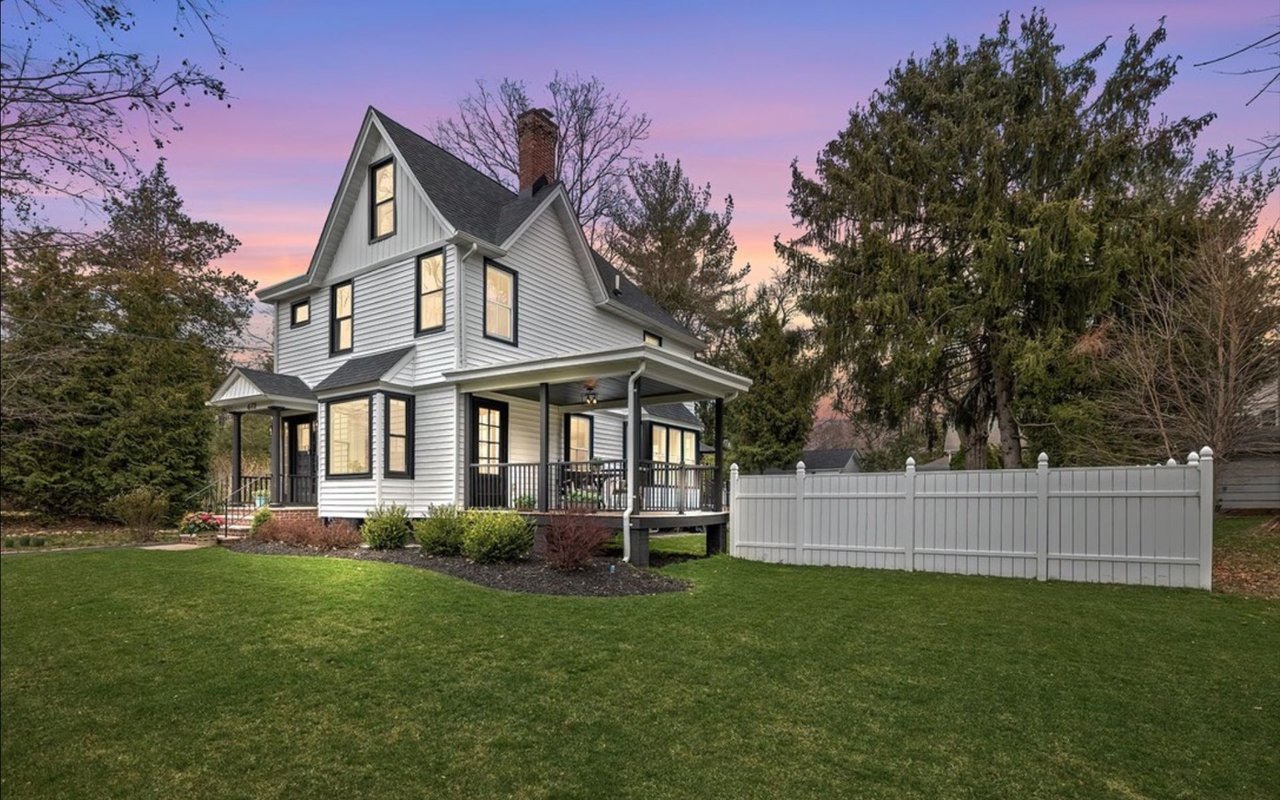
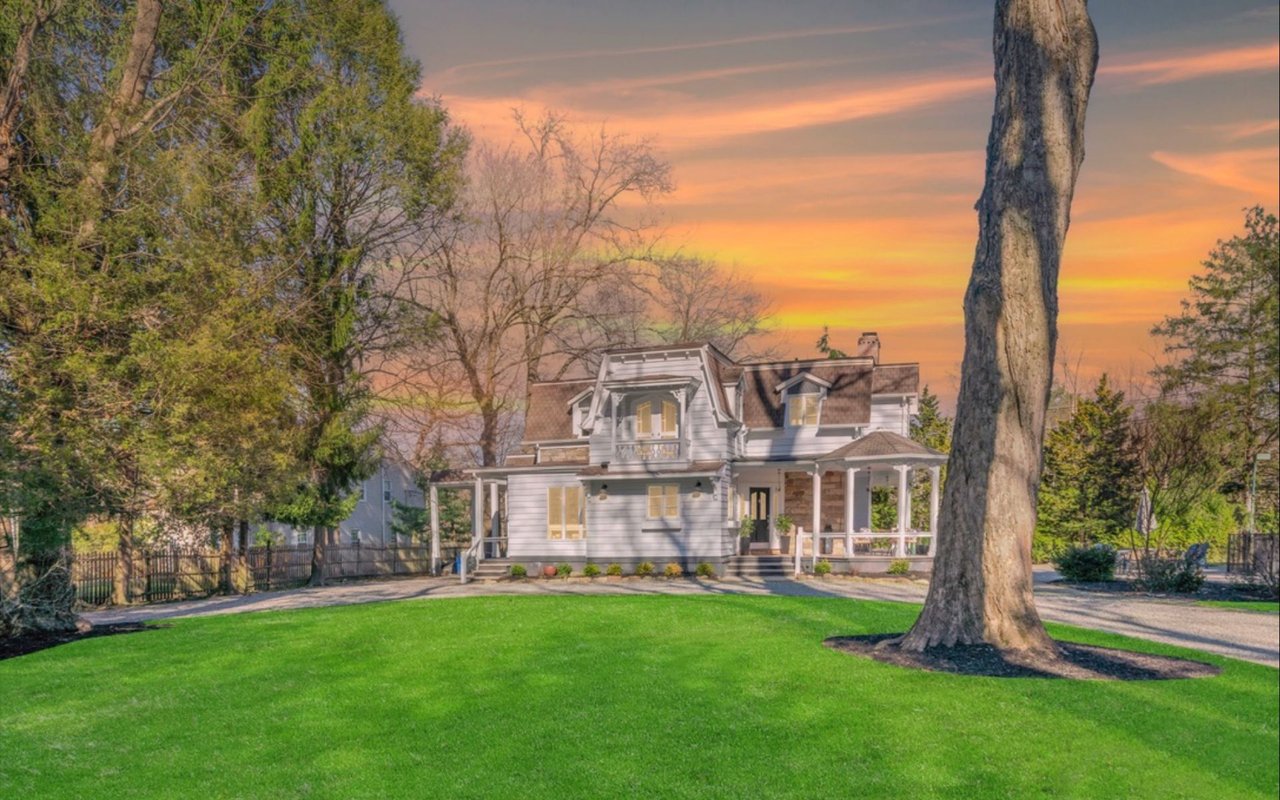
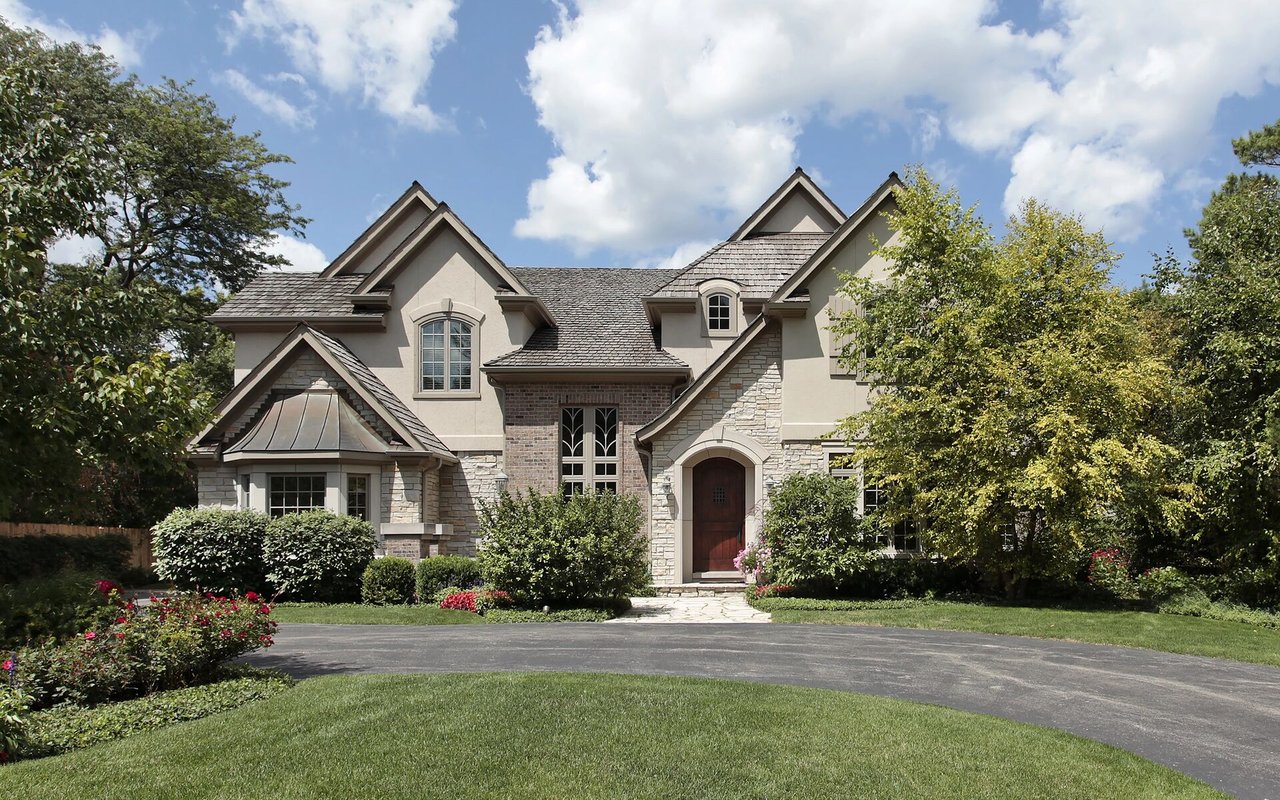
Houses with historical backgrounds remain as landmarks from colonial days and can still be found in Dumont.
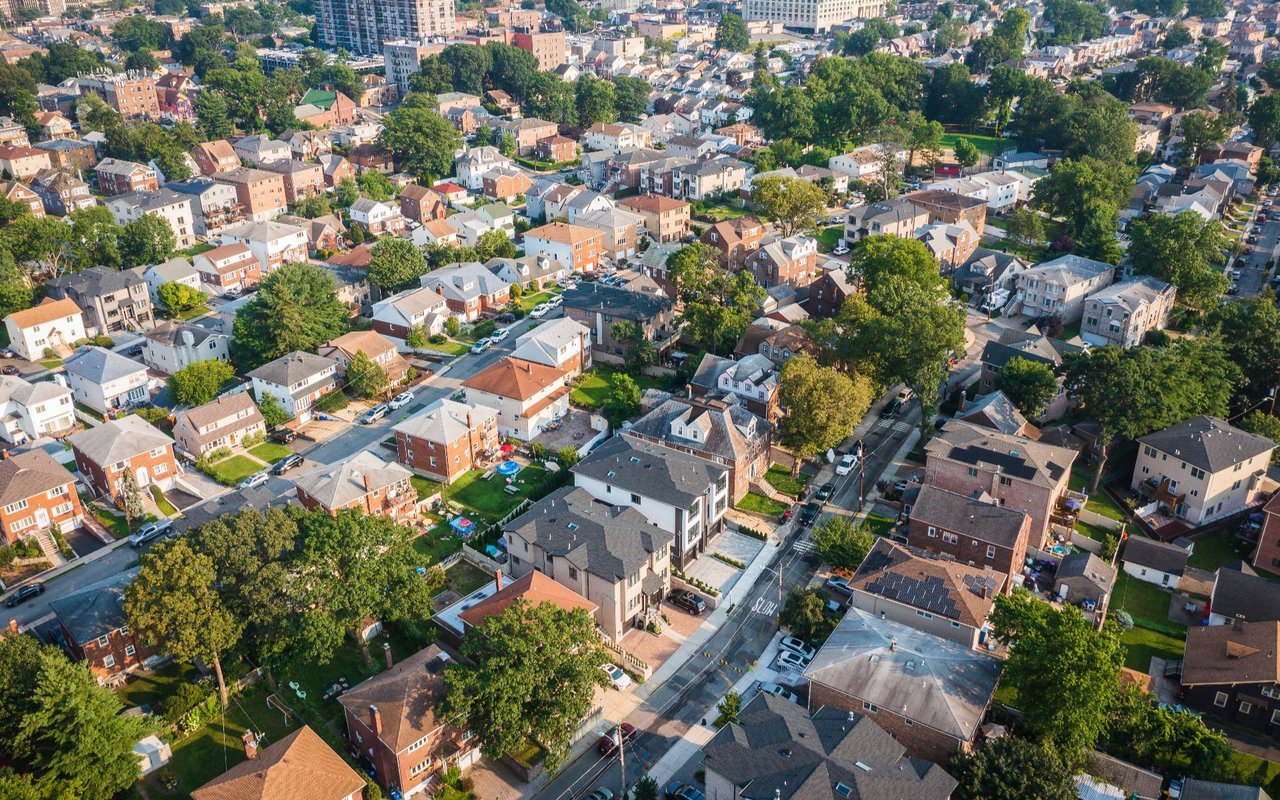
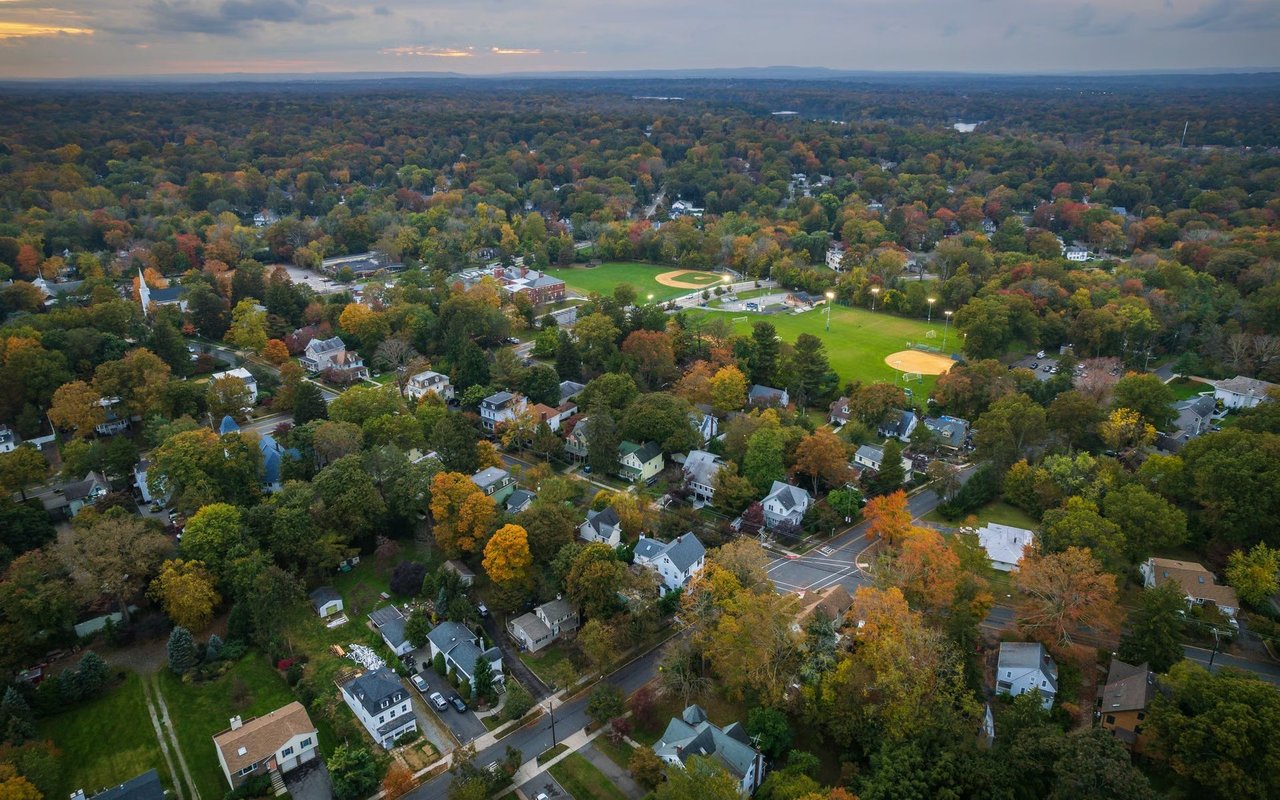
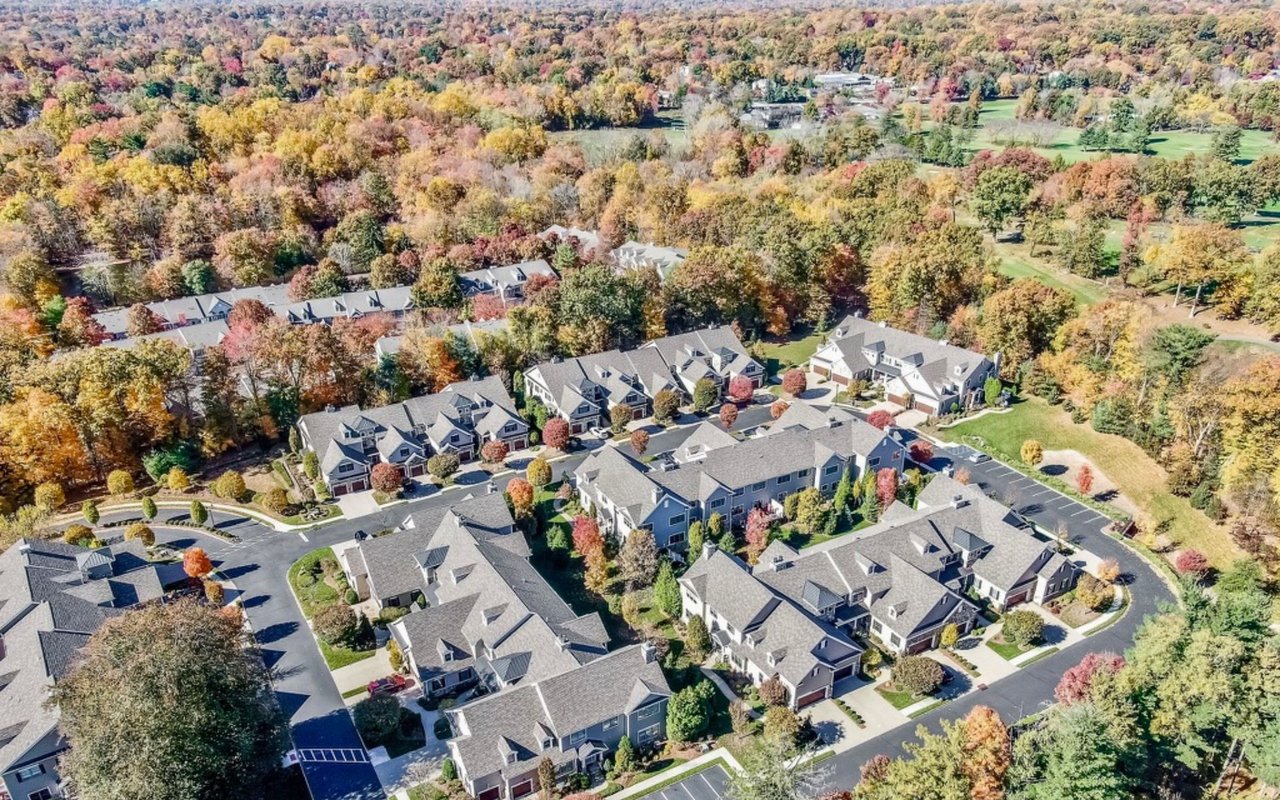
Dumont is a suburb of New York City with a population of 17,882. Dumont is in Bergen County and is one of the best places to live in New Jersey. Living in Dumont offers residents a dense suburban feel and most residents own their homes. In Dumont there are a lot of parks. Many young professionals live in Dumont. The public schools in Dumont are highly rated.
Houses with historical backgrounds remain as landmarks from colonial days and can still be found in Dumont. One such is the Albert Zabriskie house, built about 1750. It is part of the Dutch Colonial stone house at number 2 Colonial Court, and is the oldest structure still standing in Dumont. It is registered by The American Historical Society.
18,072 people live in Dumont, where the median age is 42.1 and the average individual income is $51,872. Data provided by the U.S. Census Bureau.
Total Population
Median Age
Population Density
Average individual Income
There's plenty to do around Dumont, including shopping, dining, nightlife, parks, and more. Data provided by Walk Score and Yelp.
Explore popular things to do in the area, including Jalapeno, Xplor Wine of Demarest, and Suburban Revival.
| Name | Category | Distance | Reviews |
Ratings by
Yelp
|
|---|---|---|---|---|
| Dining | 0.82 miles | 14 reviews | 5/5 stars | |
| Dining · $$ | 1.69 miles | 14 reviews | 5/5 stars | |
| Shopping | 4.67 miles | 5 reviews | 5/5 stars | |
| Active | 3.81 miles | 14 reviews | 5/5 stars | |
| Beauty | 4.87 miles | 7 reviews | 5/5 stars | |
| Beauty | 3.76 miles | 5 reviews | 5/5 stars | |
|
|
||||
|
|
||||
|
|
||||
|
|
||||
|
|
||||
|
|
Dumont has 6,491 households, with an average household size of 2.78. Data provided by the U.S. Census Bureau. Here’s what the people living in Dumont do for work — and how long it takes them to get there. Data provided by the U.S. Census Bureau. 18,072 people call Dumont home. The population density is 9,281.42 and the largest age group is Data provided by the U.S. Census Bureau.
Total Population
Population Density Population Density This is the number of people per square mile in a neighborhood.
Median Age
Men vs Women
Population by Age Group
0-9 Years
10-17 Years
18-24 Years
25-64 Years
65-74 Years
75+ Years
Education Level
Total Households
Average Household Size
Average individual Income
Households with Children
With Children:
Without Children:
Blue vs White Collar Workers
Blue Collar:
White Collar:


15 Vervalen St Closter NJ 07624
15 Vervalen St Closter NJ 07624